Examination User Progress Report Visualisation
From All n One's bxp software Wixi
When combining eCourse learning with Testing Centre to review how people are progressing, it can be useful to generate data reports to allow further analysis of progress.
bxp software (bxp) can generate a report to provide data on user progress. This report generates on screen and shows if the users in a selected Department and/or Role has completed or not completed every examination that the selected Department and/or Role has access to in the system. It gives the reporter the ability to see if the chosen Department/Role has taken an exam or not.
1 How To – Generate the report
The first step involved in the report generation is to navigate to the following system path:
Main Menu > Data Profiling > Instant – Visualisation > Visualisation – Examination – User Progress Report
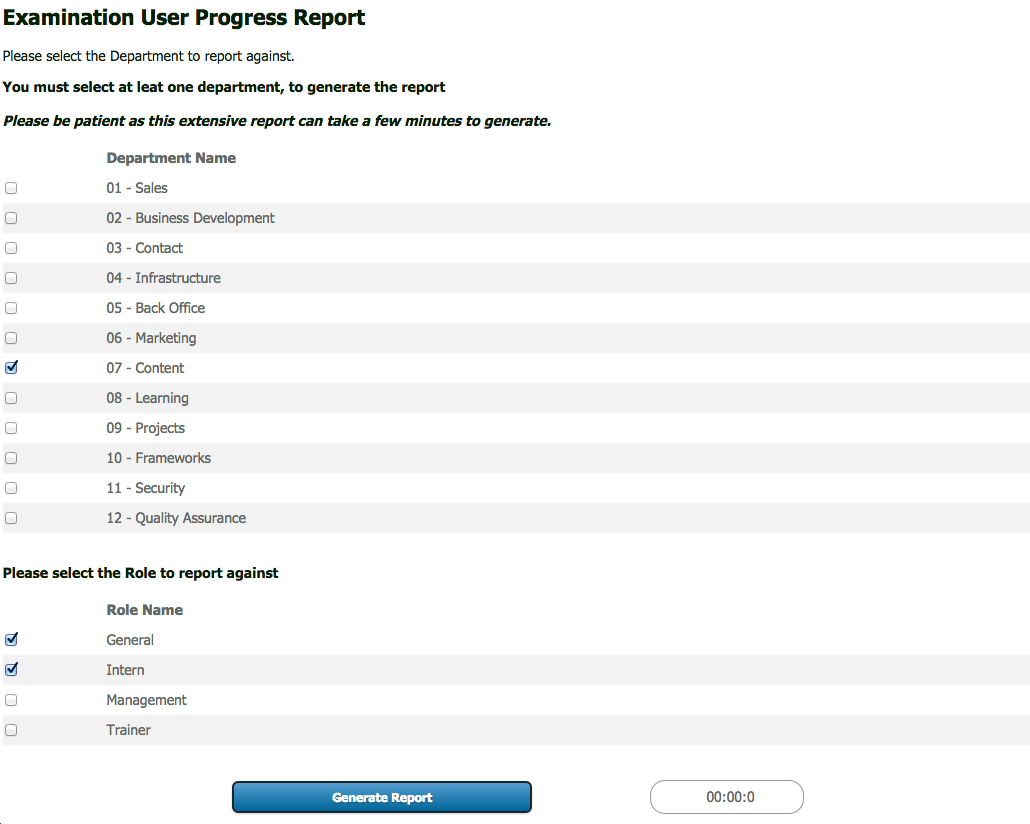
When you click on the link below you will be redirected to a page where you must select at least one department to report on. You can also select a role, or multiple roles to filter the report by. The role is an optional filter, however, you must select at least one Department
Once you have entered the criteria you need, click the generate report button located at the bottom of the page.
2 Report Contents Explained
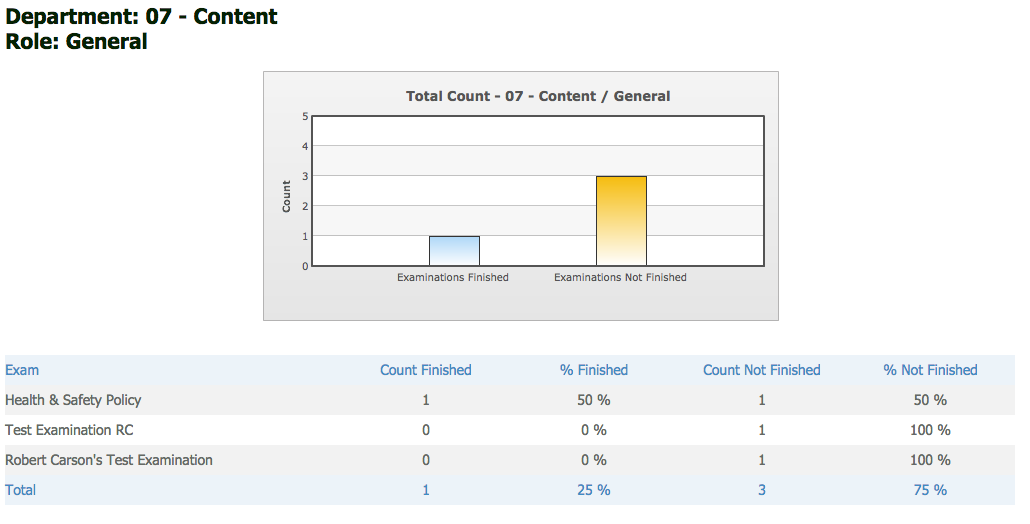
When the report is generated it will contain the following information:
- Exam – column 1 : This column contains the name of the examination the data row relates too
- Count Finished - column 2 : This column contains the number of users who have submitted an examination record
- % Finished - column 3 : This column contains the percentage of users who have submitted an examination record
- Count Not Finished - column 4 : This column contains the number of users who have not submitted an examination record
- % Not Finished - column 5 : This column contains the percentage of users who have not submitted an examination record
3 Report Figures Explained
Per Individual Examination
- Count Finished : The number of users with access to the form who have submitted a record on the examination, i.e. taken the examination
- Count Not Finished : The number of users with access to the form who have not submitted a record on the examination, i.e. not taken the examination
- % Finished : The percentage of users with access to the form who have submitted a record on the examination ( Count Finished / ( Count Finished + Count Not Finished ) * 100 )
- % Not Finished : The percentage of user who have not submitted an examination record ( Count Not Finished / ( Count Finished + Count Not Finished ) * 100 )
Total Row
- Count Finished : The Summation of all the users per form who have submitted a record on the examination ( Exam A finished count + Exam B finished count + Exam C finished count )
- Count Not Finished : The summation of all the users per form who have not submitted a record on the examination ( Exam A not finished count + Exam B not finished count + Exam C not finished count )
- % Finished : The percentage of users with access to the forms who have submitted a record on the examination ( Count Finished Total / ( Count Finished Total + Count Not Finished Total ) * 100 )
- % Not Finished : The percentage of users with access to the forms who have not submitted an examination record ( Count Not Finished Total / ( Count Finished Total + Count Not Finished Total ) * 100 )


