Rolling Totals report
From All n One's bxp software Wixi
Contents
1 Overview
Counting up records over a number of weeks would result in a number of reports having to be build, used and collated using a spreadsheet or similar. Rolling Totals provides an extremely fast and robust counting mechanism for viewing counts of records over a time period.
Other database solutions have complex database structures such as Cubes. BE provides a far simpler, real-time interface for exploring data without advanced knowledge of back end databases or custom interfaces. The term data aggregation is also often used with this discipline.
To explain our reports lets imagine a simple form with some data.
| Id | Name | Favourite Colour | Location | Date of Contact |
|---|---|---|---|---|
| 1 | Philip Lacey | Blue | Dublin | April |
| 2 | Nick Wheeler | Blue | Dublin | April |
| 3 | Chris Thomson | Red | Dublin | April |
| 4 | Santa Clause | Red | North Pole | April |
Pie charts and bar charts in the Instant Reports can easily render these statistics.
Rolling Totals is looking over these statistics over a period of time.
| Jan | Feb | Mar | Apr | May | |
|---|---|---|---|---|---|
| Dublin | 0 | 0 | 0 | 3 | 0 |
| North Pole | 0 | 0 | 0 | 1 | 0 |
2 Rolling Totals Settings
Rolling Totals reports are a number of settings that are associated / joined to a custom group. They are completely independent of any setting in the Custom Group, but require a Custom Group to attach to. It was designed this way that a data report could provide the output for a group and the Rolling Totals settings could provide a report which reflected the data being output, despite the two diverse sets of settings.
The best way to use these reports is through experimentation and playing with the options. If you require a hand with any of the configuration of these reports please feel free to give All n One support a shout and we can advise you where to go.
3 Levels
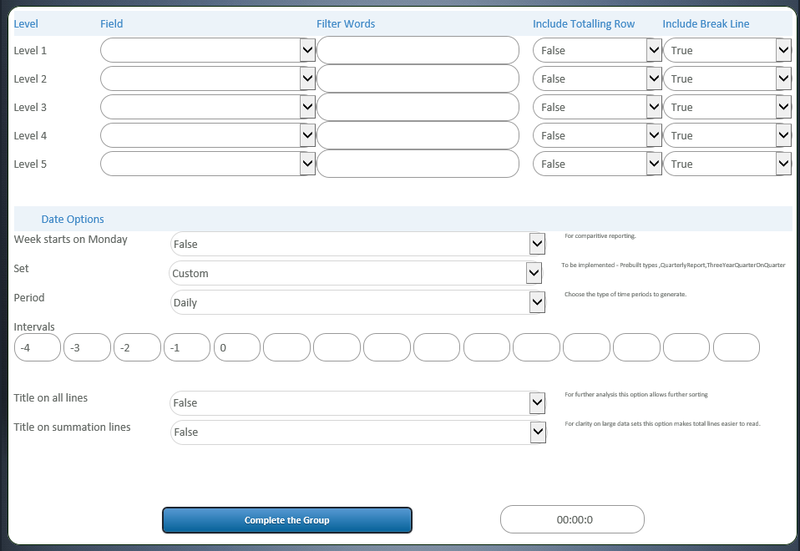
The top five levels provide the dimensions to the report. To build our example report we would simply choose “Location” at the level 1 stage and the system would perform the counts using location as the primary criteria.
If we add a second level using the field colour then we get
| Jan | Feb | Mar | Apr | May | ||
|---|---|---|---|---|---|---|
| Dublin | ||||||
| Red | 0 | 0 | 0 | 2 | 0 | |
| Blue | 0 | 0 | 0 | 1 | 0 | |
| North Pole | ||||||
| Red | 0 | 0 | 0 | 0 | 0 | |
| Blue | 0 | 0 | 0 | 1 | 0 |
If we wanted our report to ONLY include Dublin we could then add a Filter word. The filter word is a like match, not an exact match. So using Dublin would also match “Co. Dublin”, “Dublin 1”, etc. If we need to have an exact match put an ! before the word and system will perform an exact match and remove the !.
A totalling row, if turned on, adds the extra detail of saving to count up the different sections. So if we put a totalling row on the Level 1, we get (highlighted red for clarity).
| Jan | Feb | Mar | Apr | May | ||
|---|---|---|---|---|---|---|
| Dublin | ||||||
| Red | 0 | 0 | 0 | 2 | 0 | |
| Blue | 0 | 0 | 0 | 1 | 0 | |
| 0 | 0 | 0 | 3 | 0 | ||
| North Pole | ||||||
| Red | 0 | 0 | 0 | 0 | 0 | |
| Blue | 0 | 0 | 0 | 1 | 0 | |
| 0 | 0 | 0 | 1 | 0 |
A line break puts in a more visual separator between the levels. So putting in a Level 1 “Include Break Line” would display as:
| Jan | Feb | Mar | Apr | May | ||
|---|---|---|---|---|---|---|
| Dublin | ||||||
| Red | 0 | 0 | 0 | 2 | 0 | |
| Blue | 0 | 0 | 0 | 1 | 0 | |
| 0 | 0 | 0 | 3 | 0 | ||
| North Pole | ||||||
| Red | 0 | 0 | 0 | 0 | 0 | |
| Blue | 0 | 0 | 0 | 1 | 0 | |
| 0 | 0 | 0 | 1 | 0 |
It is possible to have five levels of break down. The order in which you supply the break downs can be vital in providing the most efficient report possible.
3.1 Date Options
The date options provide different configuration criteria for the report generation.
Week starts on Monday. This means for weekly based reports that the first day of the week is a Monday. If false, the first day of the week is a Sunday.
Set. The only and default option is currently Custom. This option will allow for non-consecutive time frames to be compared. For example “Three Year Quarter On Quarter” which will extract the same Quarters results over the last three years for comparison.
Period. This represents the time frame of the report.
- Daily
- Weekly
- Monthly
- Quarterly
- Yearly
In our worked example, we would have used the Monthly time frame to get April, May etc as count totals.
Intervals are for how far back you wish the report to be drawn for. Using our worked example if the current date is 25th of May 2014 and our period is Monthly then the:
-4, -3, -2, -1, 0
Represents
January 2014, February 2014, March 2014, April 2014 and May 2014, respectively.
If the time frame was daily then we would be looking at.
21st May 2014, 22nd May 2014, 23rd May 2014, 24th May 2014, 25th May 2014, respectively.
The system can handle up to 15 dates which could represent all the weeks of a quarter.
Title on all lines is an option for when the data is exported to Excel that it is easier to sort the columns of data. This works well for manipulating data but makes the report harder to read on screen.
| Jan | Feb | Mar | Apr | May | ||
|---|---|---|---|---|---|---|
| Dublin | Red | 0 | 0 | 0 | 2 | 0 |
| Dublin | Blue | 0 | 0 | 0 | 1 | 0 |
| North Pole | Red | 0 | 0 | 0 | 0 | 0 |
| North Pole | Blue | 0 | 0 | 0 | 1 | 0 |
Title on summation lines is also designed for Excel manipulation and making very complicated multi-level reports easier to read as the data headings for that row are repeated.
| Jan | Feb | Mar | Apr | May | ||
|---|---|---|---|---|---|---|
| Dublin | ||||||
| Red | 0 | 0 | 0 | 2 | 0 | |
| Blue | 0 | 0 | 0 | 1 | 0 | |
| Dublin | 0 | 0 | 0 | 3 | 0 | |
| North Pole | ||||||
| Red | 0 | 0 | 0 | 0 | 0 | |
| Blue | 0 | 0 | 0 | 1 | 0 | |
| North Pole | 0 | 0 | 0 | 1 | 0 |
4 Count Reports
There are two options for use of the reports
- Customised - Statistics - Rolling Totals - All Contacts
- Customised - Statistics - Rolling Totals - First Contact Only
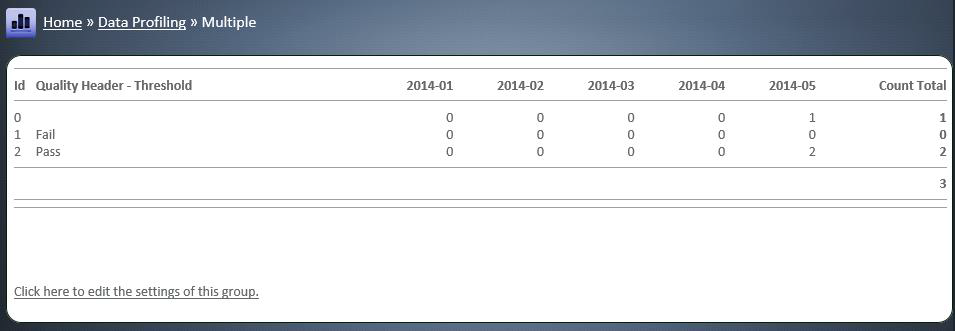
Imaging again our Nick scenario who calls in three times but in different months, would we want Nick to show once in the count report or three times appropriate in the different months. The top report “All Contacts” will show Nick appearing three times in the report. The second report will use the date and time of the first contact and display the count in the appropriate time window.
The report is available from
Main Menu > Data Profiling > Customised – Statistics > Choose your Form > Choose your Custom Group > Choose the Start Date Time to represent 0 for the Intervals settings > Generate your report.
As you experiment with the reports keep an eye out for the “Click here to edit the settings of this group”. This link takes you straight back into the Rolling Totals settings for this Custom Group.
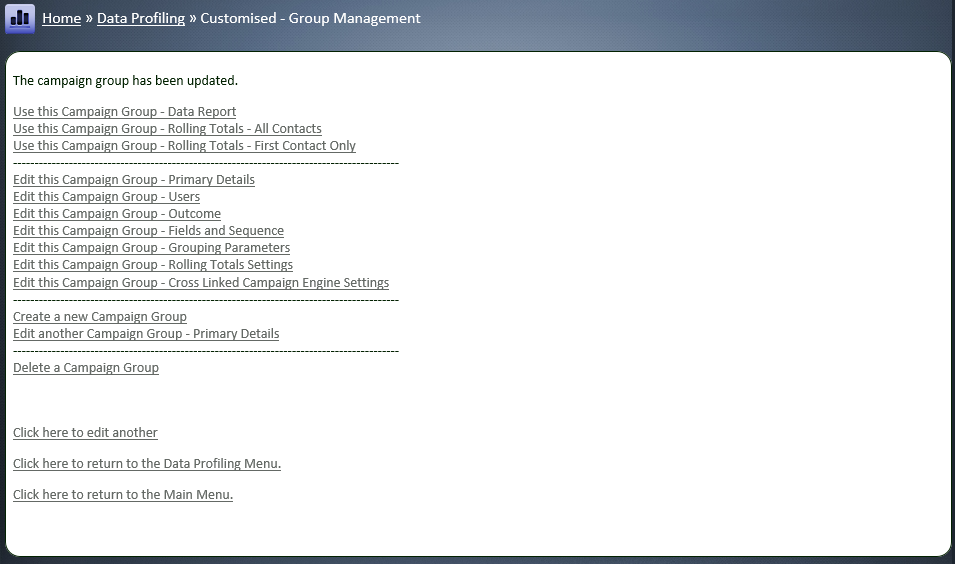
When you have finished updating the settings you can quickly return to the report using the quick links on the complete page.
5 Summation Reports
There are two options for use of the reports
- Customised - Statistics - Sum Totals - All Contacts
- Customised - Statistics - Sum Totals - First Contact Only
These are identical to the count Rolling Totals reports using the same fields and listing except that instead of counting the system will attempt to summate the values. So for instance if there was a field in our sample data set like Monthly Spend. The report could summate all the monthly spends for all those user types into a total amount.


