Data Profiling - Customised - Management
Contents
1 Overview
As seen in previous training it is possible to get your data very quickly from BE using the Instant reports. These reports are broken into the categories of Data, Statistics, Scores and Visualisations. In a Contact Centre environment the dreaded “Monday morning reports” are the industry known suite of reports that management require with information on how the previous week’s operations went with a view to using them as a basis for plans for the coming week.
Preparation of these reports is often time pressured as planning can only truly begin when the reports are in. Even though BE does have scheduling as one of its features, this does not guarantee you get the report, layout or key essential data sough by management. For this reason there is often a requirement to preform operations on the exported data to make it “usable”.
A custom group allows for manipulation of reports to reduce the amount of time required by people to customised the data output.
Some common examples would be:
- An exception only report, showing calls that required escalation for the previous week, by area.
- A team report for the output of sales for one given team
- A bar / pie chart representation of the key details for a group of records. e.g. all customers in Dublin, where our advertising campaign launched last week.
All of these reports are possible using the Instant reporting but, if these reports need to be generated week on week, it represents a lot of reporting work to tidy up the output. Custom Groups allow for a number of settings to be recorded and then these group settings can be applied to the major categories of reports.
2 Background
2.1 Forms and Form Structure
This is discussed in CC-1-3 [2.3.2] through [2.3.5]
2.2 Functional Access vs. Content Access
Functional access means having access to an operational function. An example of a function is to delete data.
Content access would be access to a QA campaign with bxp.
In order to delete data from the QA campaign, the user needs to have the functional access to delete the data and content access to be able to delete the data from the QA campaign.
In bxp, editing a user controls their functional access in the section “User Administration”. For QA, the section “Security – Content Access” provides the content access control mechanisms.
2.3 Organogram and Security Groups
This is discussed in CC-1-3 [2.3.2.10]
3 Building a Custom Group
3.1 Overview
Usage of Custom Groups requires that a custom group be set up. This allows BE to record all the settings for the group. A custom group is set up in connection with a form. It is then available to all users who also have access to that same form. This means that one person can create a custom group but it can be used by all with access to the form.
The group is then applied to the different categories of data report. There are five pages of settings which break up the configurable parameters. Not all pages are required but different ones provide different options of customisation.
3.2 Step 1 - Primary Details
This page sets the master settings available.
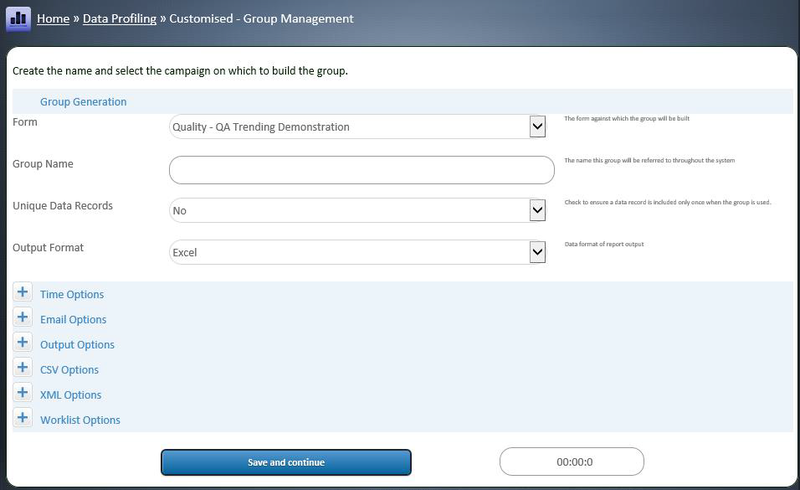
Main Menu > Data Profiling > Customised - Group Management > Group – Create
3.2.1 Overview
Allows you to create a custom group of fields in a campaign to report on:
- Choose the campaign to base the report on
- Name the Group (Report) - Save and Continue
- Choose the users/agents you wish to base the report on
- Choose the outcomes
- Choose the fields
- Reorder the fields in the report if you wish to do so
- Continue with more filtering of fields if required
- Complete the Group
3.2.2 Group Generation
Form is the form against which the custom group will be built. This is not changeable so please select carefully.
Group Name is the name by which you will recognise this group. It is often useful to put your initials and even a bit of a description of what the group does to jog your memory when you use the Custom Group later or your colleagues are trying to use it as well.
Unique Data Records as discussed in previous reporting [CC-1-4] is the setting for data reports to represent cases and contacts as a single record or as all contacts. The example is “Nick Wheeler calls is contacted three times in the same week. In the report do we represent him as one customer or three contacts.” Usage of the report will dictate how you select this option.
Output format shows the report is to be used. There are a number of options of how custom groups can be used.
- Excel: A data report in Microsoft Excel format. (default)
- CSV: A data report in Comma Separated Value format.
- XML: A document in XML 1.0 format.
- Worklist: Using the group, the records identified are presented as clickable links to bring the viewer into those records. This can serve as a worklist engine. See 2.3.6.6 for more information on this.
- CrossLinked: Where a parent-child relationship exists between two forms, the report enables the linking. See 2.3.6.5 for more information on this.
N.B. It is important to remember that the rest of the settings on this page are for tweaking purposes to fit custom processes. For this reason, the options will always be compressed up to hide the options available. By default it is not necessary to change any further settings on this page. For reference every field is now detailed and explained. Please feel free to jump to 2.3.6.2.3 to continue building your custom group.
3.2.3 Time Options
Period: This allows when the report is opened to choose a default time frame. This is saves time having to select periods on screen. Where it is far more useful is when the report is scheduled to run, this aspect sets the time frame of the reports and the Start and End time of the report is calculated from this key word.
Allow period to be changed: When generating the report on a scheduled basis it is possible to dynamically supply dates and time to the report. This option allows or denies system from automatically changing the time periods of the report. For more information on scheduled reports please see [CC-1-4]
3.2.4 Email Options
On scheduled generation of reports, this is an email notification to whomever to let them know the report has been generated and is awaiting collection / reading.
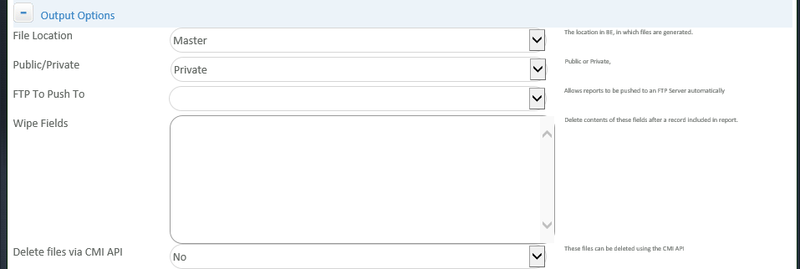
3.2.5 Output Options
File Location: When the report is generated automatically / on a scheduled basis, where should the generated report file be located. At the back of BE there are a folders for each BE Clients’ file requirements.
These folders are accessible through SFTP. This is discussed in [CC-2-2]. There are a number of options to this
- Master: the folder where all uploaded files are stored ("data\")
- Report: a dedicated subfolder of the Master folder ("data\reports\")
- OFS: if the client has the module Online File Storage, the report will be found in there. (“filestorage\")
- Library: if the client has the module Report Library, the report will be found in there. ("library\")
Public / Private: This flag allows the report to be generated on a scheduled basis or not. Public means that an external source can cause the report to generate. Private means that the report must be started by a user logged into BE selecting the group to be applied to one of the reporting categories. By default all custom groups will be private.
FTP To Push To: In the System Access Management module it is possible to create a log in to an external FTP / SFTP site. If this option is set, the report will be pushed to the site selected.
Wipe Fields: For data protection reasons some clients want to remove record data from within BE as soon as the data has been output to the report. This means that an export cleans up behind itself and for data protection reasons the data is only in one location. By specifying the fields required, BE will blank the contents of those fields as soon as the data has been exported. This action is irreversible and requires a backup restore if the data is to be brought back into BE.
Delete file via CMI API: This flag allows for an external program to wipe the report. This is used in the scenario of a security conscious third party using BE. BE is used to capture data during the day. At night, a custom group is scheduled to run and the report is generated. The FTP push to option is used which transfers the data to the third party. The third party then flags back into BE please delete the report. This ensures that no record of the details logged are stored in BE. This can also be executed before the BE backups run ensuring that no record data is stored
3.2.6 CSV Options
When creating a CSV file structure is most important. The internal structure of a CSV file could be
- Id,Firstname,Surname,Phone
- 1,Philip,Lacey,014294000
- 2,Nick,Wheeler,014294001
- 3,Chris,Thomson,014294002
Each line has three commas. What if the agent capturing the details took two numbers of Philip. So it becomes.
- Id,Firstname,Surname,Phone
- 1,Philip,Lacey,014294000,0871231231
- 2,Nick,Wheeler,014294001
- 3,Chris,Thomson,014294002
Record 1, is in error. We have a number of options. Firstly Delimiter, can be used to wrap around the text.
The most common delimiter is the single inverted comma.(')
- Id,Firstname,Surname,Phone
- '1', 'Philip', 'Lacey', '014294000,0871231231'
- '2', 'Nick', 'Wheeler', '014294001'
- '3', 'Chris', 'Thomson', '014294002'
This works fine until we bump into a surname like O'Kelly. For this reason we need an Escape character. This is most commonly a backslash. (\)
- Id,Firstname,Surname,Phone
- '1', 'Philip', 'Lacey', '014294000,0871231231'
- '2', 'Nick', 'Wheeler', '014294001'
- '3', 'Chris', 'Thomson', '014294002'
- '4', 'Malcom', 'O\'Kelly', '014294002'
3.2.7 XML Options
XML Attribute / Element: When constructing the XML of the document a <record> element is used. Within that element, the data is placed. This is the default layout.
<record>
<intCDA_X_Id>1</intCDA_X_Id>
<strCDA_X_field_0_0>Philip</strCDA_X_field_0_0>
…
</record>
Alternately the data can be appended as attributes.
<record intCDA_X_Id="1" strCDA_X_field_0_0="Philip" … ></record>XML Well formed: In XML if an element has no data to output, then the element is dropped from the data. This however can cause issues for some poorly written XML readers which expect to find the element regardless of content or not. The default setting is for BE to output well-formed XML. Well formed: False <record> <intCDA_X_Id>1</intCDA_X_Id> <strCDA_X_field_0_0></strCDA_X_field_0_0> <strCDA_
Well formed: True
<record>
<intCDA_X_Id>1</intCDA_X_Id>
<strCDA_X_field_0_1>Lacey</strCDA_X_field_0_1>
</record>
XML Extra levels: If a containing element is required around the data to match existing XML reading solutions, extra elements can be placed around the <records>. Just add the levels separated by commas and BE will reformat appropriately.
e.g. dataset,level1
<dataset>
<level1>
<record>
<intCDA_X_Id>1</intCDA_X_Id>
<strCDA_X_field_0_1>Lacey</strCDA_X_field_0_1>
</record>
</level1>
</dataset>
N.B If you need to change the element name of “record”, this is done through: Main Menu > Form Management > Form - Primary Management > Form - Advanced Settings > Choose the form > Campaign CMI API XML and Excel AutoLoad Processing Options > XML Element
3.2.8 Worklist Options
Worklists and their usage are described in 2.3.6.6 of this document.
Alternate URL: When clicking a worklist button you will be taken into the record via the Inbound contact module. It is possible to redirect the click to another page altogether, with the Form Id and CDA Id parameters also being passed. This is useful when using eCourse pages for custom builds.
Alternate URL (SQL Statement): if an SQL Select statement is passed to the Alternate URL field a custom report can be created. It will also allow for date replacements if --dteDateStart-- or --dteDateEnd-- are passed they will be replaced using passsed dates.
Open In: When the worklist button is clicked does the new URL open in the current window or is a new window / tab opened.
Include records with no CCL’s: By default Custom Groups build their reports on times. This requires there to be a CCL. When using a Custom Group as a worklist there are occasions where there are freshly loaded CDAs or CDAs brought in through the BEAPI from a public website which will not have a CCL. This option allows all CDAs regardless of time to be included in the worklist.
3.3 Step 2 - Limit by Users
This screen allows the data output of the reports to be limited to CCLs involving specific individuals. This is how a team report would be configured. Simply select the people you wish to only report on.
It is not necessary to select any user from this list. Selecting no users will include all records in the reporting.
3.4 Step 3 - Limit by Outcomes
This screen allows you to limit the report by the outcomes of relevance. You must select outcomes to have data in your report. Selecting no outcomes will result in no data in your report.
Custom Entry is provided to allow the report to include CDAs that do not yet have CCLs, or for outcomes not used at the time of the report creation.
An outcome must be used at least once for it to appear in the list of outcomes available.
Click “Select All” to save time selecting options.
3.5 Step 4 - Fields and Sequence
This screen allows you to select which fields will appear in the report. Simply check the fields you want to include.
If the field names have “New” in a lot of them, then this means that the Field Mapping was not set up correctly early on in the process. You can change the field names by simply clicking the “Open Field Mapping” button. This opens a new window with the Field Mapping process and you can adjust the column names as required. Remember to go to the bottom and click “Update Mappings.” When done close the Field Mapping new window. Refresh the Fields and Sequence page and the new field names should appear.
When the data is output it is possible to sort by any of the CDA fields. This can save a lot of time sorting data when it is exported to Excel. The format is to use the field names separated by commas, e.g.
strCDA_X_field_0_1,strCDA_X_field_0_0
Tip: It is also possible to put ,DESC at the end of this list of fields and this will make the sort order Descending instead of the default Ascending (ASC)
When you save and go the next screen you can numerically order the fields in any order you like. This saves times having to reorder output in Excel later on. Simply number the fields in the order you need.
3.6 Step 5 - Grouping Parameters
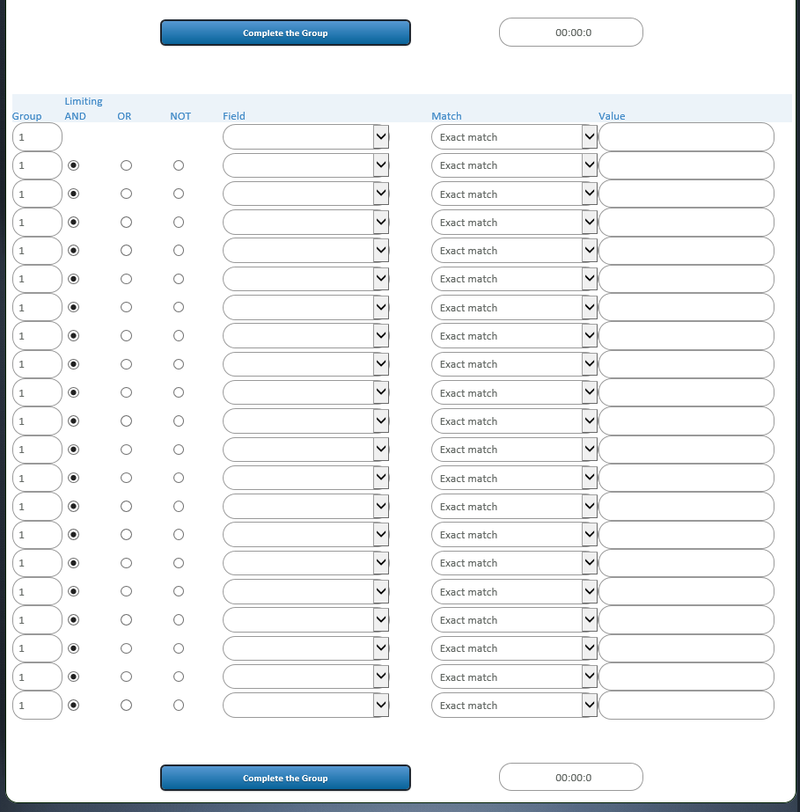
This is by far one of the most powerful features of bxp reporting available. This screen allows for very specific custom groups to be created.
If not used, the report will include all the outcomes and if used the user limitations. These parameters are for limiting the data by information stored in the CDAs.
In order to clarify the use of this report we need some sample data.
| Id, | Name, | Colour, | Location, | Date of Contact |
|---|---|---|---|---|
| 1, | Philip Lacey, | Blue, | Dublin | April |
| 2, | Nick Wheeler, | Blue, | Dublin | April |
| 3, | Chris Thomson, | Red, | Dublin | April |
| 4, | Santa Clause, | Red, | North Pole | April |
| 5, | Tony Stark, | Red, | NewYork | April |
| Field Field | Mapped Name |
|---|---|
| intCDA_X_Id | Id |
| strCDA_X_field_0_0 | Name |
| strCDA_X_field_0_1 | Colour |
| strCDA_X_field_0_2 | Location |
| strCDA_X_field_0_3 | Date of Contact |
3.6.1 Example 1: Just Dublin
| Field | Match | Value |
|---|---|---|
| Location | Exact Match | Dublin |
Result Returns 1,2,3
The query reads
Where strCDA_X_field_0_2 = ‘Dublin’
This will return any record where the Location field has Dublin in it.
3.6.2 Example 2: Dublin and New York
| Limiting | Field | Match | Value |
|---|---|---|---|
| Location | Exact Match | Dublin | |
| Or | Location Exact Match | New York |
Result Returns 1,2,3,5
The query reads
Where strCDA_X_field_0_2 = ‘Dublin’ or strCDA_X_field_0_2 = ‘New York’
This will return any record where the Location field has Dublin in it.
3.6.3 Example 3: (Dublin and Blue) or (New York and Red)
| Group | Limiting | Field | Match | Value |
|---|---|---|---|---|
| 1 | Location | Exact Match | Dublin | |
| 1 | And | Colour | Exact Match | Blue |
| 2 | Or | Location | Exact Match | New York |
| 2 | And | Colour | Exact Match | Red |
Result Returns 1,2,5
The query reads
Where (strCDA_X_field_0_2 = ‘Dublin’ and strCDA_X_field_0_1 = ‘Blue’ ) or ( strCDA_X_field_0_2 = ‘New York’ and strCDA_X_field_0_1 = ‘Red’ )
The Group number brackets fields and options. When there is a change of number the Group puts the condition between the brackets. If you have any challenges in setting up and configuring these reports please feel free to contact us at support@bxpsoftware.com
4 Report Differences
4.1 Data
There are two sections to the Customised – Data type
- Customised - Data
- Customised - Data - All Contacts - By Group
- Customised - Data - Filtered
- Customised - Data - All Contacts - By Group with Filter
The first allows you to generate the data reports as you would with the Instant – Data reports except that all the settings are stored in the Custom Group, so you don’t need to remember to tick anything.
The second option performs a useful function when you have third parties wanting to extract data from the system. The most common example of this is a marketing agency who wish to get data in real time, but are not entitled to customer specific information.
Prior to setup, you decide which fields the marketing agency can and can’t see. Using
Main Menu > Data Profiling > Customised – Group Management > Group – Customised Data Filtered – Select filter fields > Choose the Form > Select the protected fields.
You then grant permission to the Media Agency to Data Profiling > “Customised - Data – Filtered” section. They can now see all of the reports you have created on the form. However when they pull the data, all the filtered fields will be removed. In this way you can create your reports and give a third party access to the same reports without fear of protected data being revealed.
The CSV and XML files are also accessed through this retrieval approach.
4.2 Statistics
As the Instant – Statistics are self-contained reports that do not require modification.
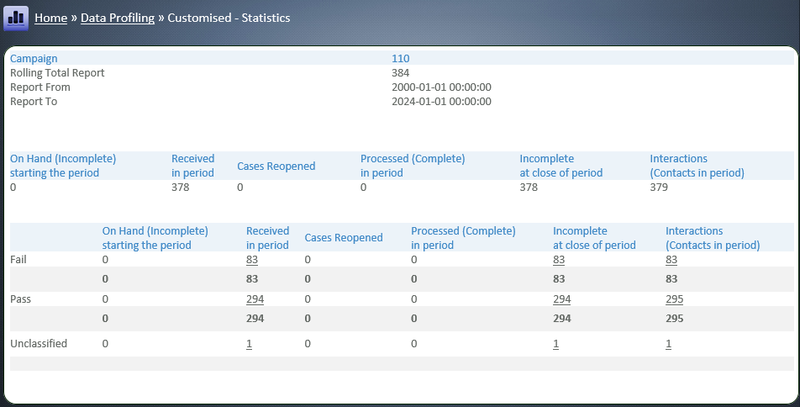
Instead there are statistics reports which are more focused on process large volumes of data into usable data statistics. These reports are called Rolling Totals reports as they provide a statistical rolling time total grid with various limiting criteria. The Rolling Total is a counting report. More details are provided on Rolling Totals in 2.3.6.4
- Customised - Statistics - Rolling Totals - All Contacts
- Customised - Statistics - Rolling Totals - First Contact Only
It can also be required on this rolling basis, to summate numerical fields, so two further reports are also provided for quick mathematical statistical results.
- Customised - Statistics - Sum Totals - All Contacts
- Customised - Statistics - Sum Totals - First Contact Only
These reports are a lot faster than adding up the amounts. There are also requirements to see for a select group of uses the outcomes that have occurred for selected time periods. For example for all sales in the Dublin area where we are running a printed ad campaign, what outcomes have we achieved. This count of outcomes for given groups is available in:
- Customised - Statistics - Outcome Totals - Last Contact - All Periods
Case management is a way of viewing records that have multiple contacts to complete them. Case management is explained in greater detail in [CC-4-4]. However statistics vital to case management can be further refined using the Custom Groups. Quality is another example of where multiple touch points with a single record are required to bring it to completion. This report is available in:
- Customised - Statistics - Case Management - Status Reporting
4.3 Scores
As Testing Centre, Survey and Quality Assurance use weightings to position how well staff and programs are doing, it can be necessary to limit the output of standard scoring reports to be filtered.
This option is not available in all systems as it requires an initial understanding of setup requirements to tailor the reports to work correctly.
- Customised - Scores - Data - Grouped Assessments
4.4 Visualisations
As the visualisations in the Instant reports provide an instant view of closed questions and a timed view of closed questions, so the Custom Group provides the same two reports but allows focus to be placed on specific data groups and then the reports rendered.
The same customisation of the visualisation reports is used in these reports as is used in the Instant ones.
For more options have a read of Data_Visualisation_Options


